

“Pitch me a short” is a standard request in buy-side interviews. Interview guides treat pitching longs and shorts as the core skill a hedge fund screens for (Street of Walls). A short pitch built only on valuation is easy to challenge. A stronger answer starts with accounting red flags you can point to in the filings and quantify in a model.
Short answer: Accounting red flags are gaps between reported earnings and the cash, assets, and disclosures behind them. The fastest way to find them is to rebuild the company’s three-statement model and test where the statements stop agreeing. A red flag becomes a short thesis only when you can size the overstatement, name a catalyst, and show asymmetric downside.
This guide shows where each flag appears in the model and runs one illustrative company through five tests. It then turns the result into a thesis with a price target and kill criteria.
Key Takeaways
- An accounting red flag signals risk, not fraud. Aggressive accounting is often legal.
- Earnings-quality flags show up first in the working capital lines of the cash flow statement.
- Converging signals matter more than any single ratio. In the worked example below, five flags converge while the Beneish M-Score stays below its −1.78 threshold.
- A short thesis needs four layers: the accounting issue, its quantified earnings impact, a catalyst, and a valuation with defined kill criteria.
Table of Contents
- What Are Accounting Red Flags in a Short Thesis?
- Where Do Accounting Red Flags Show Up in a Three-Statement Model?
- Worked Example: Five Red Flags From One Set of Financials
- How Reliable Is the Beneish M-Score?
- Which Disclosures Confirm or Kill a Red Flag?
- What Is a Broken Narrative, and How Do You Spot One?
- How Do You Turn Accounting Red Flags Into a Short Thesis?
- When Is an Accounting Red Flag Not a Short?
- FAQ
- Conclusion
What Are Accounting Red Flags in a Short Thesis?
Accounting red flags are patterns in the financial statements suggesting that reported earnings overstate the cash or economic value a business generates. In a short thesis, they matter only if the overstatement is material, likely to reverse, and not yet reflected in the share price. A red flag starts an investigation. It does not prove misconduct.
Two categories need to stay separate. Aggressive accounting uses judgment within the rules, for example optimistic reserves or generous cost capitalization. Fraud breaks the rules. A short thesis built on aggressive accounting argues that earnings will disappoint. A thesis built on fraud makes a far heavier claim and needs far more evidence.
The distinction also protects your credibility in an interview. Calling a company “a fraud” based on rising receivables invites an easy rebuttal. Arguing that revenue recognition has pulled sales forward, and quantifying by how much, invites a discussion.
Where Do Accounting Red Flags Show Up in a Three-Statement Model?
Accounting red flags show up wherever the income statement, balance sheet, and cash flow statement stop telling the same story. Revenue that does not turn into cash builds receivables. Costs that are not expensed build assets. Both effects pass through the operating section of the cash flow statement, which makes it the first place to look.
The table maps the most common flags to the model line where you will see them.
| Red flag | Where it appears in the model | Test | Common benign explanation |
|---|---|---|---|
| Revenue pulled forward | Accounts receivable on the balance sheet; “change in receivables” in CFO | Days sales outstanding (DSO) trend vs. peers | Longer payment terms for new enterprise customers |
| Earnings without cash | Net income vs. cash flow from operations (CFO) | Cash conversion = CFO / net income | Working capital investment during fast growth |
| Inventory build | Inventory on the balance sheet; “change in inventory” in CFO | Days inventory outstanding (DIO) vs. sales growth | Stocking ahead of a confirmed product launch |
| Costs parked on the balance sheet | Capitalized development or software costs; investing cash flows | Capitalized costs / revenue, compared with peers | Genuine development projects that meet capitalization criteria |
| Adjusted earnings drift | Non-GAAP reconciliation in the earnings release | Adjusted EBITDA minus GAAP operating income, by year | One-off items that do not recur |
Read the model, not just the ratios. A model forces every change in receivables, inventory, and capitalized costs to show up as a cash outflow. If free cash flow turns negative while net income climbs, the model has already told you where to dig. Building that model from a blank Excel sheet is the same skill tested in an investment banking modeling test.
Worked Example: Five Red Flags From One Set of Financials
The following illustrative company is an industrial distributor with $1,058 million in FY2025 revenue. It shows how several accounting red flags emerge from one consistent set of statements. All figures are hypothetical, in $ millions, and the balance sheet balances in every year. Revenue grows 15% per year, so headline growth looks steady.
Assumptions (illustrative)
| Line item ($m) | FY2023 | FY2024 | FY2025 |
|---|---|---|---|
| Revenue | 800.0 | 920.0 | 1,058.0 |
| Gross margin | 35.0% | 36.0% | 34.0% |
| EBIT | 80.0 | 112.0 | 124.0 |
| Net income (25% tax rate) | 48.8 | 71.3 | 78.0 |
| Accounts receivable | 110.0 | 145.0 | 210.0 |
| Inventory | 90.0 | 105.0 | 140.0 |
| Capitalized development costs (balance) | 50.0 | 70.0 | 105.0 |
| Cash flow from operations (CFO) | 70.0 | 75.3 | 38.0 |
| Capital expenditures | n/a | 74.0 | 66.0 |
| Capitalized development (cash spent) | n/a | 20.0 | 35.0 |
| Free cash flow (CFO − capex − capitalized development) | n/a | −18.8 | −63.0 |
FY2025 CFO is built bottom-up. Start with net income of $78.0 million and add back D&A of $46.0 million. Subtract the receivables build ($65.0 million), the inventory build ($35.0 million), and higher other current assets ($3.0 million). Add $17.0 million from higher payables and accruals to reach CFO of $38.0 million.
Test results
| Test | Formula | FY2023 | FY2024 | FY2025 |
|---|---|---|---|---|
| DSO (days) | Receivables / revenue × 365 | 50.2 | 57.5 | 72.4 |
| Receivables growth vs. revenue growth | Year-over-year change | n/a | 31.8% vs. 15.0% | 44.8% vs. 15.0% |
| DIO (days) | Inventory / COGS × 365 | 63.2 | 65.1 | 73.2 |
| Cash conversion | CFO / net income | 1.44x | 1.06x | 0.49x |
| Accrual ratio | (Net income − CFO) / average total assets | n/a | −0.5% | 4.0% |
| Beneish M-Score | Eight-variable model, FY vs. prior FY | n/a | −2.23 | −1.87 |
Five signals point the same way in FY2025:
- Receivables: DSO rose from 57.5 to 72.4 days in one year. Receivables grew three times as fast as revenue.
- Cash conversion: CFO covered only 0.49x of net income, down from 1.44x two years earlier.
- Inventory: DIO rose by eight days while gross margin fell two percentage points, a combination that often precedes discounting or write-downs.
- Capitalization: Capitalized development costs grew 50% to $105.0 million, more than three times the rate of revenue growth.
- Funding: Free cash flow was −$63.0 million, financed by $50.0 million of new long-term debt.
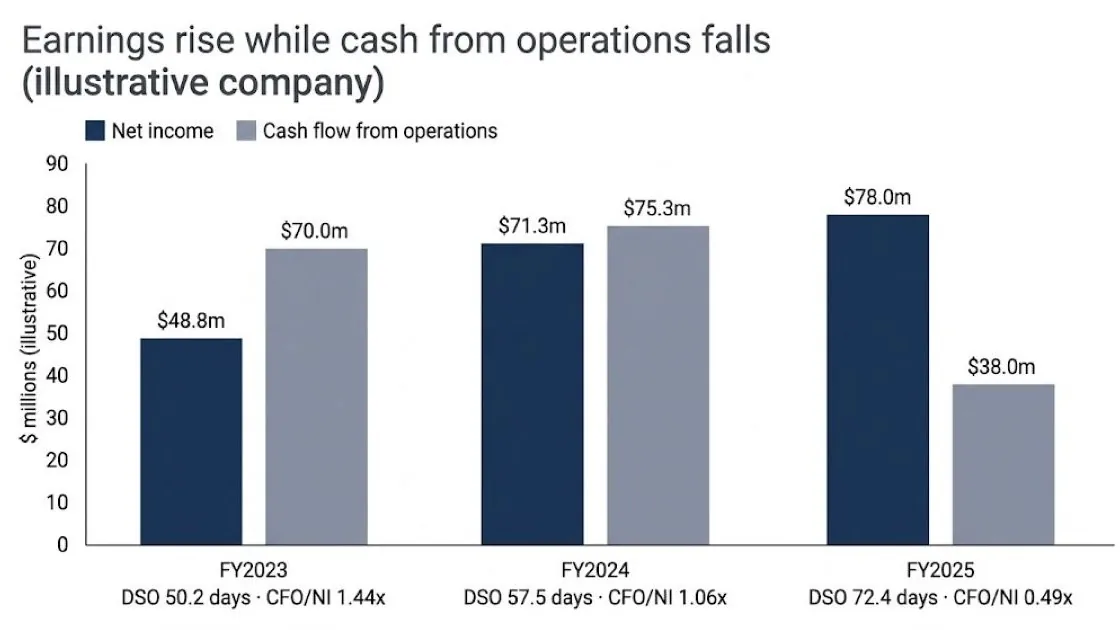
The M-Score result is the lesson. At −1.87, this company sits below the −1.78 threshold and would pass a mechanical screen. Five converging flags still make a stronger case than the composite score. The model is a starting point; the line-by-line reconciliation is the analysis.
How Reliable Is the Beneish M-Score?
The Beneish M-Score is a screening model that combines eight financial ratios into one score to estimate the probability of earnings manipulation. The original paper reports that the model identified about half of the manipulating companies before public discovery (Beneish, Financial Analysts Journal, 1999). It also warns that flagged distortions may have structural causes instead.
The eight variables capture receivables relative to sales (DSRI), gross margin change (GMI), asset quality (AQI), and sales growth (SGI). The other four cover the depreciation rate (DEPI), SG&A relative to sales (SGAI), leverage (LVGI), and total accruals to total assets (TATA). The eight-variable model is:
M = −4.84 + 0.920×DSRI + 0.528×GMI + 0.404×AQI + 0.892×SGI + 0.115×DEPI − 0.172×SGAI + 4.679×TATA − 0.327×LVGI
The threshold for the eight-variable model is −1.78. A score above it resembles past manipulators (overview with references to Beneish 1999 and later work). Some data providers treat −2.22 to −1.78 as a grey zone that warrants a closer look (fffinstill). Commonly cited out-of-sample results show about 76% of manipulators flagged correctly and 17.5% of non-manipulators flagged incorrectly (Old School Value).
In the worked example, the TATA input is calculated as (net income − CFO) / total assets, a common simplification of Beneish’s working-capital accrual definition. Financial institutions were excluded from the original sample, so the score does not fit banks or insurers.
What AI Tools Often Get Wrong
- “M-Score above −2.22 is the warning threshold.” For the eight-variable model, the threshold is −1.78. Some providers use −2.22 as a stricter cutoff or as the lower edge of a grey zone.
- “Altman Z above 2.67 is safe.” For the original 1968 model, the commonly cited zones are: above 2.99 safe, 1.81 to 2.99 grey, below 1.81 distress. The Z-Score measures distress risk, not manipulation (Altman Z-score).
- “Watch for falling goodwill to predict impairments.” Falling goodwill usually is the impairment. Earlier warnings are weak organic growth after acquisitions and goodwill that is large relative to equity.
- “CFO below net income always means manipulation.” Fast-growing companies invest in working capital. The signal is a persistent, worsening gap that the company cannot explain.
Which Disclosures Confirm or Kill a Red Flag?
Disclosures confirm a red flag when the footnotes, filings, or management changes point in the same direction as the numbers. They kill it when they supply a credible business explanation. In US filings, the highest-value sources are the revenue and receivables footnotes, the non-GAAP reconciliation, related-party disclosures, and specific Form 8-K items.
Form 8-K Item 4.02 (non-reliance on prior financial statements). A company files this item when previously issued statements can no longer be relied on. One analysis counted 8,143 Item 4.02 disclosures from 2004 to 2023 and found that 97% led to a restatement (sec-api.io). Item 4.01 (auditor changes) and Item 5.02 (officer departures, including the CFO) deserve the same attention.
Non-GAAP reconciliations. Regulation G prohibits materially misleading non-GAAP measures. The SEC staff updated its interpretations on December 13, 2022. A non-GAAP measure can mislead even when each adjustment is disclosed in detail (SEC staff interpretations). Track the gap between adjusted EBITDA and GAAP operating income every year. A “one-time” charge that appears every year belongs in the base case.
Related-party transactions. Under Item 404 of Regulation S-K, registrants disclose related-person transactions above $120,000. Smaller reporting companies use the lower of $120,000 or 1% of average total assets for the last two fiscal years (TheCorporateCounsel.net). Check whether key customers, suppliers, or distributors are on that list.
From the SEC Record: Channel Stuffing at Quarter-End
In its Symbol Technologies cases, the SEC alleged fraudulent revenue recognition, including quarter-end stuffing of the distribution channel to meet revenue and earnings targets. The company paid a $37 million civil penalty (SEC Litigation Release No. 23247, April 27, 2015). In a model, this pattern appears as receivables rising faster than revenue, often followed by returns and credits.
What Is a Broken Narrative, and How Do You Spot One?
A broken narrative is a gap between the story management tells and the numbers the company reports. Management describes strong demand while DSO climbs. It highlights new store openings while revenue per store falls. The accounting red flag explains how earnings are inflated; the broken narrative explains why the market has not noticed yet.
Two accounting researchers compiled 55 fraud red flags. One sign that manipulation may already have occurred is sales that do not match operating data such as store count or headcount (ElgarBlog, 2023). Operating KPIs are often reported outside the audited statements. That makes them a useful cross-check.
To test the narrative, list every KPI management repeats on earnings calls. Then model what the financial statements should look like if each KPI were true. Where the model and the reported numbers diverge, you have a specific question for the next call and a specific line for your thesis.
From the SEC Record: Growth the Numbers Could Not Support
The SEC alleged that Virbac used channel stuffing, sham transactions, and post-period revenue to meet projections and sustain an image of rapid growth. In one period, revenue was inflated by as much as 9% and net income by as much as 694% (SEC Litigation Release No. 19746, June 28, 2006). A small revenue overstatement can create a large earnings overstatement, because the inflated revenue carries almost no cost.
How Do You Turn Accounting Red Flags Into a Short Thesis?
An accounting red flag becomes a short thesis when you can state what is overstated and by how much. You also need the event that will expose it and the price that implies. Each layer needs a number. Without a quantified impact and a catalyst, you have an interesting observation, not a position.
Use four layers:
- Accounting issue: “DSO rose 15 days in FY2025 while capitalized development grew 50%.”
- Quantified impact: “Normalized EPS is about half of reported EPS.”
- Catalyst: A cash flow miss, a guidance cut, an auditor change, a receivables write-off, or a refinancing.
- Valuation and kill criteria: A downside target, an upside risk case, and the evidence that would prove you wrong.
Normalizing the worked example. Two adjustments rebuild FY2025 earnings on a cleaner basis:
| Adjustment ($m, illustrative) | Calculation | After-tax impact |
|---|---|---|
| Revenue pulled forward | Receivables at FY2024 DSO: 57.5 / 365 × 1,058.0 = 166.8. Excess receivables: 210.0 − 166.8 = 43.2. Gross profit at 34.0%: 14.7 | −11.0 |
| Development costs expensed, as peers do | FY2025 capitalized development: 35.0 | −26.3 |
| Normalized net income | 78.0 − 11.0 − 26.3 | 40.7 |
Assume 50 million shares and illustrative multiples. Reported EPS is $1.56 and normalized EPS is $0.81. At 20x reported EPS, the stock trades at $31.20. A bear case of 15x normalized EPS ($0.814 unrounded) implies $12.21, a 61% decline. A bull case of 24x reported EPS implies $37.44, a 20% loss on the short. The reward-to-risk ratio is about 3.0 to 1, before borrow costs.
Define the kill criteria in advance. In this example, the thesis fails if DSO returns below 60 days for two quarters or CFO recovers above net income. It also fails if the footnotes show that capitalized projects are generating revenue. Short positions also carry borrow costs, recall risk, and squeeze risk, so position size has to reflect that the catalyst may take longer than expected.
To practice building and defending this kind of model under interview conditions, see the Interview-Ready Package and individual modeling programs.
When Is an Accounting Red Flag Not a Short?
An accounting red flag is not a short when a credible business explanation exists or the overstatement is too small to move valuation. It also fails when the market already prices the problem. Many companies show rising receivables or negative free cash flow for legitimate reasons. The skill lies in ruling those reasons out with evidence.
Common reasons a red flag fails as a short:
- The explanation checks out: Longer payment terms, an acquisition, or a seasonal quarter-end can explain a DSO jump. Check subsequent collections in the next 10-Q.
- The impact is immaterial: A $2 million reserve release does not matter for a company with $500 million in operating income.
- The market already knows: High short interest and a low valuation multiple suggest the issue is priced in.
- There is no catalyst: Aggressive but consistent accounting can persist for years.
The depth of this analysis also varies by role. Credit and long/short equity analysts test earnings quality constantly. Investment banking analysts rarely pitch shorts, but the same reconciliation makes a model review faster and a client model easier to defend.
Checklist: Red-Flag Tab for Your Model
- DSO, DIO, and DPO for at least three years, compared with two peers
- Cash conversion (CFO / net income) and accrual ratio by year
- Capitalized costs as a percentage of revenue, by year
- Adjusted EBITDA minus GAAP operating income, by year
- Beneish M-Score with all eight components visible
- Form 8-K Items 4.01, 4.02, and 5.02 filed in the last three years
- Related-party transactions with customers, suppliers, or distributors
- Management KPIs modeled against reported revenue
- Normalized EPS, catalyst list, downside and upside price, kill criteria
FAQ
Is net income higher than operating cash flow always a red flag?
No. Growing companies often invest in receivables and inventory, which pushes CFO below net income for a period. The gap becomes a red flag when it persists for several years, widens, and has no explanation in the footnotes.
What is a good cash conversion ratio?
Usually above 1.0x for a mature, profitable company, because CFO adds back non-cash expenses such as depreciation. A falling trend matters more than any single level. Compare the ratio with close peers, because capital-intensive businesses run structurally higher.
What is the difference between the Beneish M-Score and the Altman Z-Score?
The Beneish M-Score estimates the probability of earnings manipulation. The Altman Z-Score estimates the risk of financial distress. A company can score clean on one and poorly on the other, so the two answer different questions in a short thesis.
What does a Form 8-K Item 4.02 filing mean?
It means the company has concluded that previously issued financial statements should no longer be relied on. In most cases, a restatement follows. For a short seller, it can be both a confirmation and a catalyst.
Is an auditor change a red flag?
Sometimes. Routine rotation or a cost decision is common. Resignations, disagreements over accounting, or a change shortly before a delayed filing deserve a close look at the Item 4.01 disclosure.
What is a catalyst in a short thesis?
A catalyst is an event that forces the market to recognize the overstatement. Typical examples are a cash flow miss, a guidance cut, an auditor change, a restatement, or a failed refinancing. Without a catalyst, an overvalued stock can stay overvalued for a long time.
Conclusion
Accounting red flags are useful only when you can trace them through the three-statement model and put a number on them. A single ratio, including the Beneish M-Score, is a screen, not a thesis.
Start with the next company you plan to pitch. Build a red-flag tab with DSO, cash conversion, capitalized costs, and the non-GAAP gap for three years. Then write the four layers, including the kill criteria, before you talk about the target price.
Free 30-Minute Short Pitch Consultation
Reading about red flags is not the same as quantifying one under interview pressure. Talk with an active finance professional about where your short pitch stands.
- An assessment of your current earnings-quality and three-statement modeling level
- 2–3 concrete next steps before your interview or recruiting deadline
- An honest recommendation: which package fits, or whether self-study is enough
Book Your Free Consultation → Calendly
About Financial-Modeling.com
Financial Modeling LLC (Financial-Modeling.com) provides Excel-based financial modeling training in New York City and live online. Active finance professionals teach 1-on-1 or in small groups of up to five participants, and every model is built from a blank Excel sheet. Programs cover three-statement, DCF, LBO, M&A, and credit models for students, career switchers, and analysts, as well as for corporate FP&A teams, boutique investment banks, and private equity firms.
This article is for educational purposes only and does not constitute investment, legal, or tax advice.
Last updated: October 20, 2026
Sources
- Beneish, M. D. (1999). “The Detection of Earnings Manipulation.” Financial Analysts Journal 55(5). CFA Institute abstract
- Beneish M-Score overview
- Old School Value, Beneish M-Score
- fffinstill, Beneish M-Score
- Altman Z-score overview (Altman, Journal of Finance, 1968)
- SEC staff, Non-GAAP Financial Measures C&DIs
- sec-api.io, Item 4.02 study
- TheCorporateCounsel.net, Item 404 and smaller reporting companies (July 19, 2023)
- SEC Litigation Release No. 23247 (Symbol Technologies), April 27, 2015
- SEC Litigation Release No. 19746 (Virbac), June 28, 2006
- Amat, O. and Lloret, P., “Accounting Fraud: 55 Red Flags,” ElgarBlog, September 28, 2023
- Street of Walls, Hedge Fund Interview Questions
- Featured image: AI-generated illustration created for this article. It does not show real people or a real company model.